These Bitesize pages will help if you need to recap on the basics of magnets. A magnetic field is produced whenever current flows through a wire. The magnetic field is represented by a series of concentric circles around the wire, as shown below.

Magnetic field lines around a current carrying wire. image: physick wiki
The direction of the arrows on these magnetic field lines is found using a left hand rule:
Point your thumb in the direction of electron flow, then wrap your fingers around the wire. The direction in which your fingers curl is the same as the arrow direction.
A charged particle will experience a force as it moves through a magnetic field – apart from the special case where the particle enters parallel to the magnetic field lines. There are different ways to determine the direction of the force acting on the charged particle. The following method works for negatively charged particles.
Hold out your right hand and make a fist like Batman.…BIF!
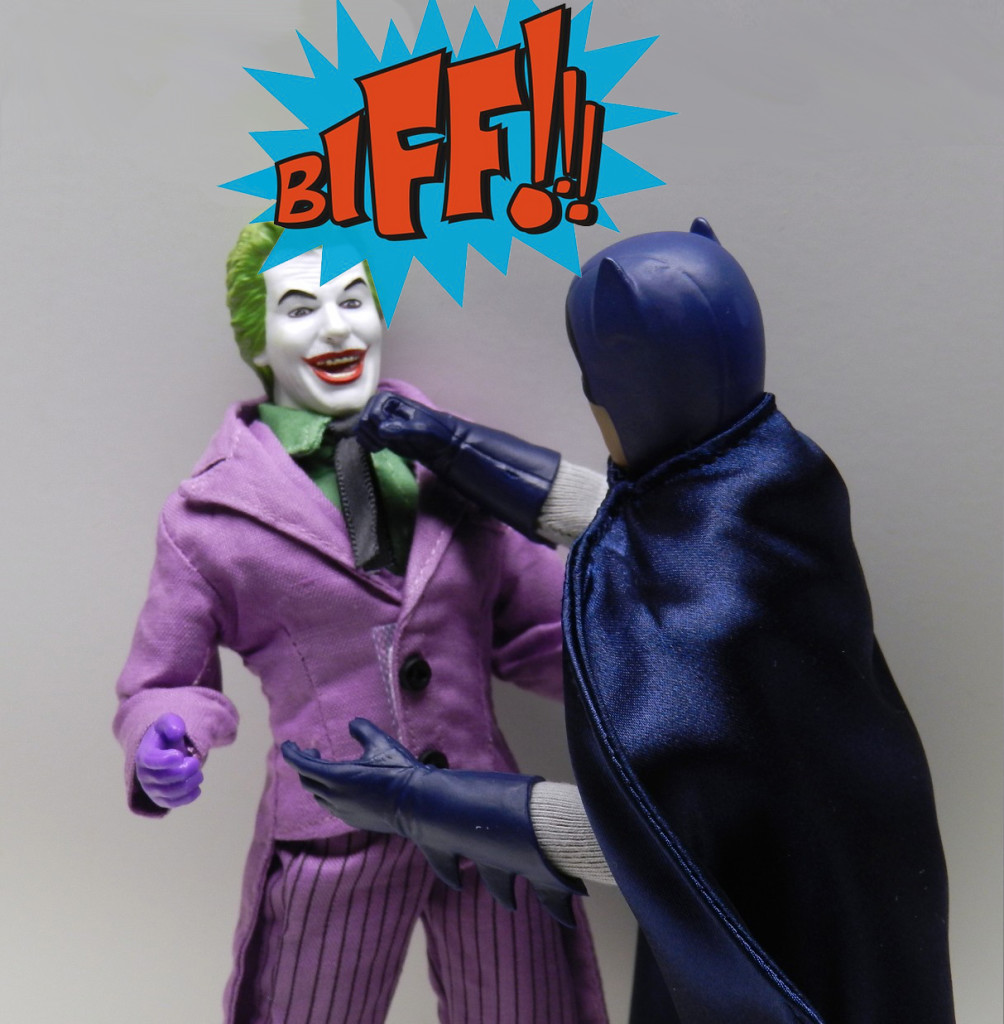
Batman making a fist with his right hand. image: infinitehollywood.com
Still thinking about BIF…
- Straighten your thumb (B), first finger (I), and middle finger (F) so they are at 90 degrees to one another, like the x,y,z axes on a graph.
- Align your thumb so it points in the same direction as the arrows† on the magnetic field lines (B).
- Rotate your right hand until the first finger direction matches the path of the negative particle (I).
- Your middle finger will reveal the direction in which magnetic force (F) acts on the negative particle.
† if no field lines are shown, position your thumb so it points from N to S in the magnetic field
If you’ve done everything correctly, the fingers of your right hand will look like this.
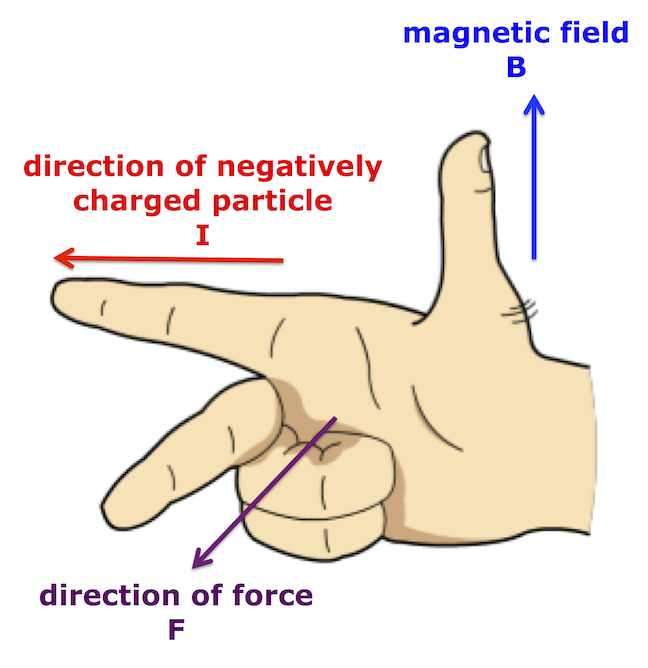
Right hand rule for negatively charged particles in a magnetic field.
If you are working with positive particles, there are two options:
- use your left hand instead of the right, keeping the same BIF order for the fingers OR
- use the right hand rule described above but reverse the direction of the force at the end.
Try both methods and decide which is best for you.
If you opt to use different hands, make sure you know which hand to use for each type of charge.
Why do we use B as the symbol for magnetic fields? I have no idea, but there are some suggestions here.

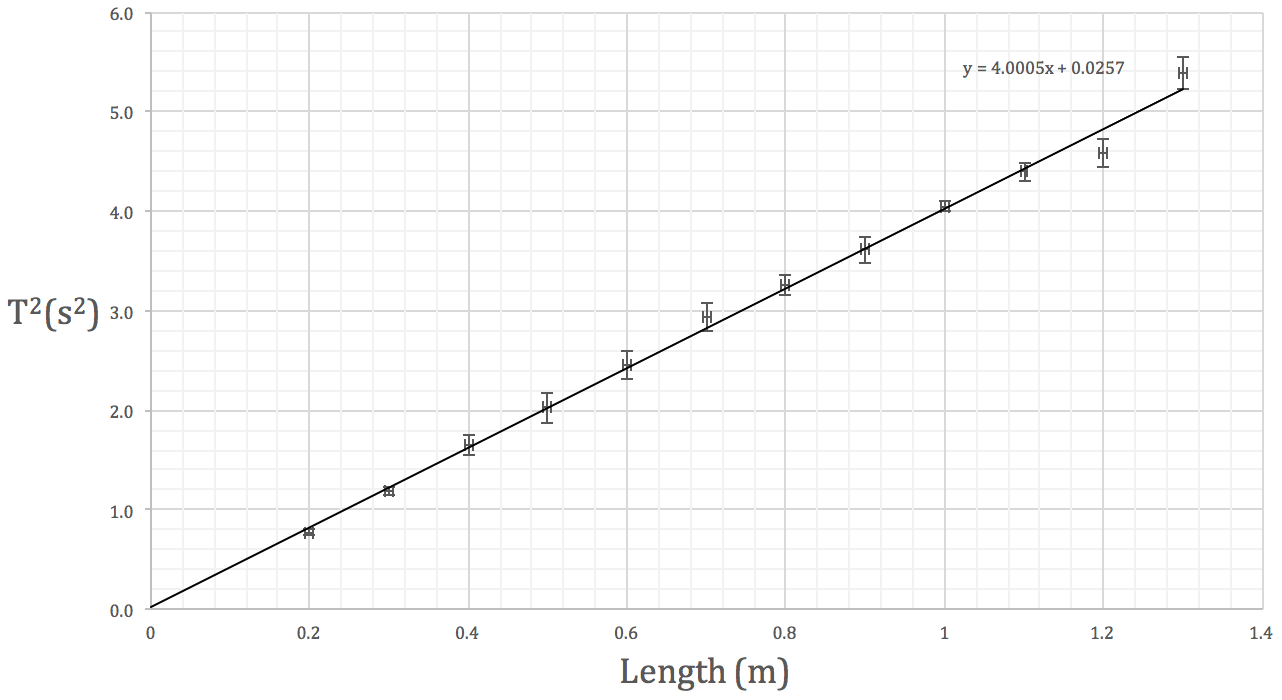
 against length, determining g from the gradient of the line of best fit.