using linest to obtain a gradient and uncertainty

The period T of a simple pendulum can be calculated using

T=2 \pi \displaystyle \sqrt{l \over g}

where l is the pendulum length and g is the gravitational field strength.

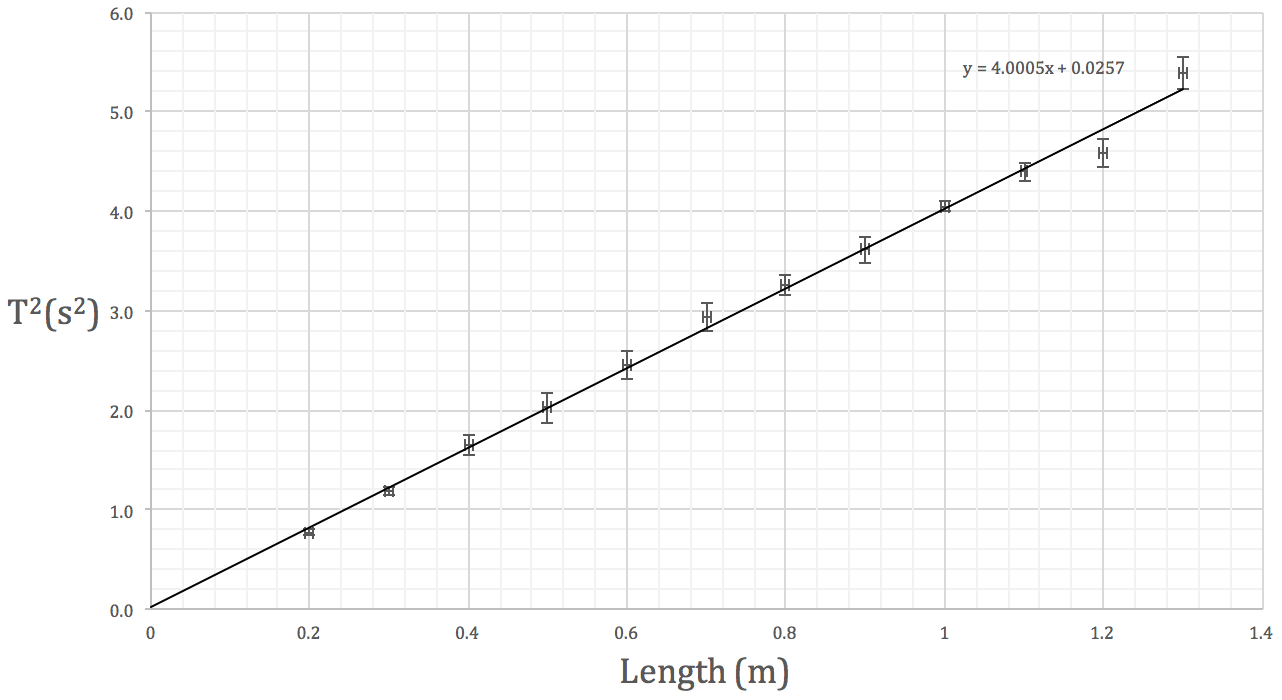
Using a single value of length and period, we can determine the acceleration due to gravity.  However, it would be better experimental practise to vary the length of the pendulum and plot a graph of T^2 against length, determining g from the gradient of the line of best fit.

You’re going to spend the next few periods analysing your simple pendulum data.  The attached pdf will walk you through the steps.  It would be better if you used your own results but I’ve put some sample data on the first page if you’ve forgotten to bring yours.

If you are using your chromebook, there may be subtle differences from the Excel instructions I have provided.  Let me know if anything doesn’t work and I’ll try to help.

Note that if you are using your own data, there will be no random uncertainty as measurements were not repeated.

Using Excel for your LO3 and Investigation

We’ll spend the next two lessons in the library learning how to use Excel.  Download the instructions using the link below.  If you have your own LO3 data, feel free to work with those values instead of the numbers I have provided.

By the end of this activity you will be able to;

  • manipulate raw data using formulae in cells
  • plot a graph of your results
  • add error bars to your graph
  • add a line of best fit
  • calculate the gradient and y-axis intercept of your line

AH – help using Excel

This tutorial will help you with adding a line of best fit to your LO3 graph.  If you use the linest function, you can extract useful information on gradient and intercept of the line.  There are also screenshots to show how error bars can be added to individual points.

Excel Tutorial: Using LINEST function, Plotting a graph, Adding Error Bars

I have added a download link to a short pdf on the use of linest.


Using excel for AH Physics investigation graphs

We spent some time today looking at ways of analysing data obtained from your investigation experiments. It is often a good idea to generate a graph of your results.  Your graph does not have to be drawn by hand, it can be produced on a spreadsheet.  If you do decide to use a spreadsheet, remember to print the gridlines on your final version of the graph.

If you use Excel, there is a function called linest that can be used to determine the gradient of the best-fit line and the intercept with the y-axis.  If you follow the instructions below, the linest function will also calculate the uncertainty in the gradient and intercept point for you.

Here is a linest tutorial to get you started.  It also includes instructions on how to add custom error bars to your graph.

Excel Tutorial: Using LINEST function, Plotting a graph, Adding Error Bars

I have included a pdf of a different help sheet – download it using the link at the end of this post.