
Here are the Scholar notes for unit 2 of the traditional Higher Physics course.
Higher

higher scholar notes – unit 1
Here are the notes for unit 1 of the traditional Higher Physics course.
Higher unit 3 solutions to practice NAB
Here are the solutions to the practice NAB. Please try the questions before looking at this file. Any questions that can’t wait ’til the start of term? Try the BBC Bitesize Radiation & Matter site or my Higher page.
Higher unit 3 practice NAB
Here is the practice NAB for unit 3. Please download these questions and use them to gauge your readiness for the nab, which will be in the first week of term – see dates under the calendar.
viewing the solar eclipse
We spoke about the eclipse in class today. It’s really important that you follow advice for watching the eclipse safely to avoid permanent damage to your eyes.
You can buy eclipse viewing glasses online. They look like this
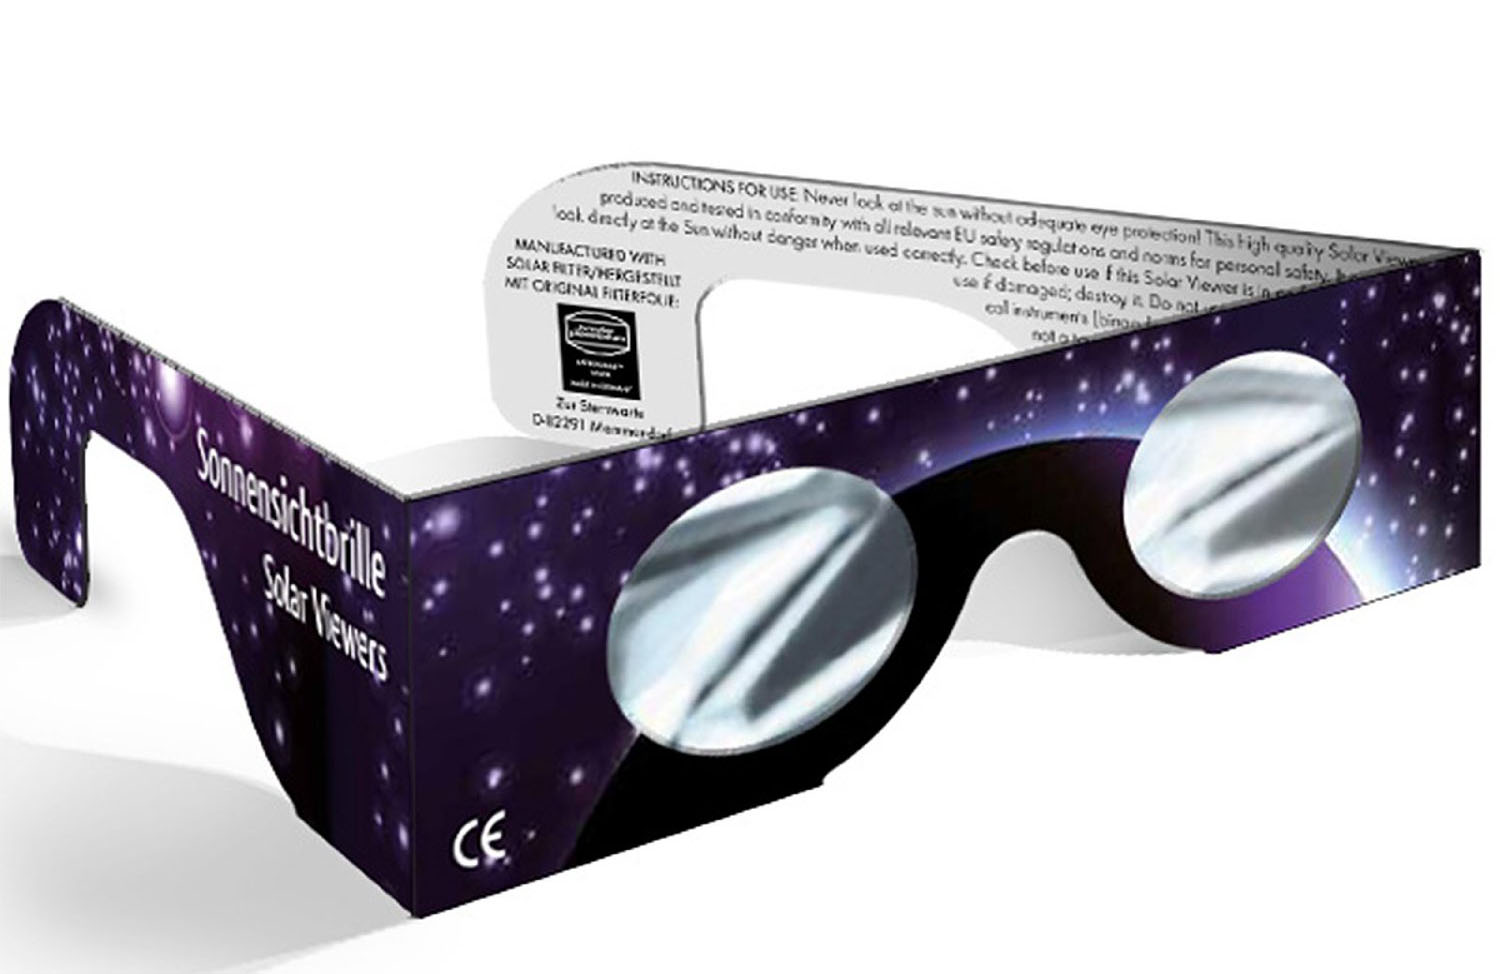
and only cost a few pounds per pair. Make sure any glasses you buy have the CE mark on them.
Here is one UK retailer of eclipse viewing glasses who still has them in stock.
Although we’re not in the totality (100%) zone, Thurso is well placed to get a good view. Here is a simulation for Orkney, our view will be very similar. Click on the picture to start to animation.
Solutions to practice NAB for Higher unit 2
Here are the solutions to the practice NAB for unit 2.
Check your answers carefully. Did you;
- mix up the equation for charged particles with those for capacitors?
- remember to calculate the period of an ac signal in seconds?
- make the correct substitutions for V1 and V2 in the differential amplifier question?
- use “it” instead of nouns in your explanations?
Higher unit 2 practice NAB
Here is a practice NAB for unit 2.
capacitor revision
You recently completed the topic on capacitors in dc circuits, finishing off with a detailed study of the graphs obtained for current & voltage against time when a capacitor is charged or discharged through a series resistor. There are some additional notes and practice questions at the end of this post but please watch the embedded video clips first.
This introduction to capacitors from the nice people at Make Magazine is a good starting point.
The S-cool revision site has some helpful notes and illustrations on capacitor behaviour; try page 1 (how capacitors work) and page 2 (charging and discharging).
There is information on charging and discharging capacitors on BBC Bitesize.
Here is a video that covers some of the areas covered in your printed notes. Ignore the maths at the end of each section of the film, you won’t need it. Notice how the man in the film uses a lightbulb, rather than an ammeter, to show when the current is large or small. Clever, eh?
You must be explain how a flashing neon bulb can be controlled using a capacitor & resistor arranged in series. Here is a short video introduction to help with that.
Blinking Neon Bulb (5F30.60A) from Ricardo Alarcon on Vimeo.
There are people working to replace heavy battery packs with modern, high capacitance devices called supercapacitors. These supercapacitors have superior energy storage compared to the normal electrolytic capacitors you will have used in class. This video goes one step further and shows the fun you could have with an ultracapacitor. Do not try this at home!
Of course, you can always make your own capacitor with paper and electrically conductive paint.
Finally, you looked at capacitors in ac circuits. You need to know that a capacitor will allow an ac current to flow. The current in such a circuit will increase as the current increases. Mr Mallon’s site has a revision activity about capacitors in ac circuits.
Now download the pdf below. It contains notes to help with your prelim revision and some extra capacitor problems.
Thanks to Fife Science for the original pdf from Martin Cunningham.
internal resistance revision
Earlier in unit 2, you worked in groups to complete an experiment on internal resistance. Listed as “Method 2″ on page 8 your printed notes, you built a simple series circuit using a cell, a resistance box and an ammeter. A voltmeter was connected across the resistance box and you recorded the voltage across (TPD) & current through the resistor as you changed the resistance from 0.5Ω to 1.5Ω in steps of 0.1Ω. The aim was to draw a graph of your data and use this plot to determine the internal resistance of the cell.
The video below shows the same type of experiment, but uses a potato and two different metals in place of a normal cell. Watch the video and note the values of I and V each time the resistance is changed – remember to pause the video each time so you can write the results. Just scroll back if you miss any.
Now plot a graph with current along the x-axis and TPD along the y-axis. If you don’t have any sheets of graph paper handy, there is a sheet available to download using the button at the end of this post. Or you could try printing out a sheet from a graph paper site, use Excel or download the free LibreOffice.org Calc spreadsheet.
Draw a best-fit straight line for the points on your graph and find the gradient of the line. When calculating gradient, remember to convert the current units from microamps (uA) to amps (A).
The gradient of your straight line will be a negative number. The gradient is equal to -r, where r is the internal resistance of the potato cell used in the video.
You can obtain other important information from this graph;
- Extend your best fit line so that it touches the y-axis. The value of the TPD where the line touches the y-axis is equal to the EMF of the cell. (Explanation: on the y-axis, I is zero so TPD = EMF)
- Now extend the best-fit line so that it touches the x-axis, the current at that point is the short-circuit current – this is the maximum current that the potato cell can provide when the variable resistor is removed from the circuit altogether and replaced with just a wire.
Higher – school closure work
With the school closure today, I’ve posted some revision work for the Wheatstone Bridge. Please read through the revision section and attempt the questions in the attached pdf.
We’re coming to the end of the topic that investigates the behaviour of a Wheatstone Bridge. The bridge circuit is really just a pair of potential dividers (voltage dividers) dividers connected in parallel. A voltmeter, ammeter or galvanometer (very sensitive ammeter) connects the two potential divider chains together, as shown below.

When the voltage (or current) displayed on the meter is zero, we say that the Wheatstone bridge is balanced. For a balanced bridge, it is possible to show that

[you have this proof in p11 of your notes folder]
For the circuit shown above, the voltmeter will display the difference in electrical potential between points B and D. We can calculate this potential difference by finding the voltages at points B and D using the voltage divider equation you used for National5/Standard Grade/Intermediate 2 Physics.

So in this example,

and
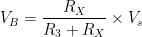
The voltmeter displays the potential difference between these two points, i.e.

Here is a short video that provides a recap of the Wheatstone Bridge.
and a worked example from an old SQA past paper
Now click on the picture below to try an interactive Wheatstone Bridge problem (you will need to have Java installed).

Instructions:
- Press the Reset button to change the value of all the resistors in the circuit.
- Use the slider to balance the bridge. The circuit uses a centre-zero meter, so aim to get the indicator dead centre.
- Find the unknown resistance (R4) using the value of the other 3 resistors when the circuit is balanced.
You can repeat this simulation as many times as you like by pressing Reset to change the resistor values…..it’s great practice!
Here is an example of an application of the Wheatstone Bridge, called the metre bridge.
When a Wheatstone Bridge is slightly out of balance, it will provide a linear response. In other words, small changes in resistance will produce proportionally small changes in voltage or current. When these small changes are plotted, we obtain a straight line through the origin, like this:

This property of a Wheatstone Bridge can be used to find the temperature of the physics classroom if one of the resistors is replaced with a thermistor – see p14 of your notes. The thermistor is immersed in a beaker of ice & water (I used snow one year – see photo) and the Wheatstone Bridge is balanced while the thermistor is cold. Note the temperature of the ice/water mixture and the reading on the galvanometer.

Without touching the resistance box settings, the thermistor is placed in warm water and the reading on the galvanometer is recorded, along with the water temperature. Now plot these two points on a graph, with temperature on the x-axis and current on the y-axis. Draw a straight line between the two points (I know, I know!)
Remove the thermistor from the beaker and leave it sitting on the desk for a few minutes. Check the new galvanometer reading and use your graph to find which temperature would give this value for current.
When we did this on Monday (5.5 class), we found that the graph predicted a room temperature of 14°C, 20°C or 25°C, depending on the group. The digital thermometer in the corner of the room showed 17°C. Why is there a difference?
As we discussed on Monday, this experiment is flawed due to the way resistance of a thermistor changes with temperature (you might remember this from Nat5/SG/Int2).

Since the resistance is not proportional to temperature, we will not get an accurate answer…..unless we stay very, very close to the temperature at which we balanced the Wheatstone Bridge. In this case, we tried to cover too large a range of temperatures. For temperature ranges much smaller than the 80°C we attempted, it is possible to obtain an accurate estimate of room temperature.
Click on the download link below to try some Wheatstone Bridge questions.