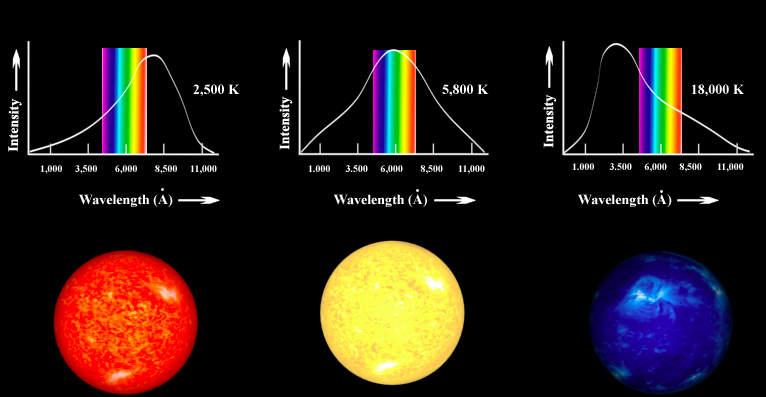
We’ve been looking at how the temperature of an object can affect it’s appearance. The attached handout recaps on our work in class and provides some examples of line spectra.
star temperature
the Hertzsprung-Russell diagram
Our Sun is a typical yellow star, so its emission would be represented by the middle star in this image.
image courtesy of kstars, kde.org – colour is exaggerated
The colour of a star also tells us something about the expected behaviour of a star, it’s lifetime, and destiny. This is achieved by plotting stars on a Hertzsprung-Russell diagram. More about HR diagrams here.
This video clip looks at how the stars are arranged on the HR diagram.
Hertzsprung Russell diagram from mr mackenzie on Vimeo.
While some HR diagrams use temperature along the x-axis, others use star classification.


