Finding the distance to a thunderstorm

The thunderstorm this morning reminded me that I was going to post something about calculating the distance to a storm.

Play this video and then replay it, paying close attention to the time index at the bottom.  You will need to move your cursor over the video box to keep the time visible.

Lightning from Daniel Dingemanse on Vimeo.

Can you calculate the distance between the flash of lightning and the camera?

Hint: take the speed of sound in air as 340 m/s.

Newton III in action – continued

This amazing footage of the Saturn V rocket launch for the Apollo11 moon landing mission has been put online by Mark Gray.  The video provides an extra dimension to the launch photograph in my earlier post about Newton’s 3rd law of motion.  While that picture shows an enormous plume of gas being forced out of each rocket exhaust, the video below demonstrates the heat of the gases and the effect they have on the structure of the launch pad itself.

Apollo 11 Saturn V Launch (HD) Camera E-8 from Mark Gray on Vimeo.

standard grade physics summary notes

I found a great set of summary notes provided by the Physics Department at James Gillespie’s High School in Edinburgh.  They cover the entire course, so are quite long.  The diagrams are very clear and I would recommend working your way through them as part of your preparation for the May exams.

The notes are in a pdf file so they will work with iTunes or you can download them by clicking on the link below.

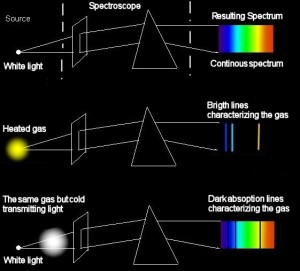
colour, temperature and emission spectra

Today we looked at emission spectra from different light sources; mercury, sodium, cadmium and oxygen discharge tubes, using a handheld spectroscope.

Here is a video that shows you how to make a basic spectroscope at home.  There are lots of guides like this online.  You might prefer to make a larger spectroscope by using a Pringles tub rather than an old toilet roll holder as the main tube.

I have attached the handout on colour and emission of light from different elements below.

ray diagram – object closer than 1f

This post is for Standard Grade and Intermediate 2.

Here we consider an object closer than one focal length.  You will see that it is not possible to obtain a real image when the object is this close to the lens.  On a ray diagram, a real image is one that is found on the other side of the lens from the object.

Real images can always be displayed on a screen – a projector in the cinema or classroom produces a real image.  If you are doing an experiment, you can check to see if an image is real using a piece of paper.  Move your sheet of paper closer to and further from the lens – if you can’t get an image to form on the paper then the image must be virtual.  When we look at an object up close through a magnifying glass, we see a virtual image.

ray diagram for objects closer than 1f from mr mackenzie on Vimeo.

how to draw a ray diagram

If you are sitting Credit Standard Grade or Intermediate 2 you should be able to draw a ray diagram for a convex lens.

At Standard Grade you must be able to draw this diagram for a magnifying glass.  A video for this will be posted shortly.

Intermediate 2 candidates may be asked to draw the diagram for an object placed

  • closer than one focal length
  • between one and two focal lengths
  • more than two focal lengths

from the convex lens.  I will post a video showing each of these three situations.

Let’s start with an introduction to drawing ray diagrams.  This video looks at an object between one and two focal lengths from the lens.  It will show you how to draw the diagram and explain the terms we use to describe the image.

how to draw a ray diagram from mr mackenzie on Vimeo.

Disclaimer: No rabbits were harmed in the making of this video.