old Higher Physics past papers

We looked at projectiles and radiation today.  The past paper questions we tried were taken from 1992-1999.  I’ll post some of these papers on the blog so you can try some more of them.  Note that the exam used to have two papers, paper I was multiple choice and paper II was the written paper.

There is a complete set of answers for these papers here.  Sorry, that link seems to be dead now.  You can get them here instead.

This paper is reproduced to support SQA qualifications on a non-commercial basis according to SQA conditions of use.

Higher revision notes

We are heading towards hardcore revision season now.  I’ll be at the Easter study school on Monday and Tuesday to help with areas of difficulty.  I’m also going to start posting some additional resources, sometimes it helps to get a different person’s perspective on the course.

Let’s start with a set of whole course notes I found online.  It’s a pdf that summarises everything in the Higher course.  You can use the download button or let iTunes do the downloading (easier option).

See you on Monday!

Day 454: Acre Study by amanky

Attribution-NonCommercial-NoDerivs License

diffraction grating simulation

We used the grating equation

 n \lambda = d \sin \theta

today to predict the location of bright fringes produced by a diffraction grating.  Remember that d in this equation is the distance between adjacent lines in the grating and not the number of lines per metre/millimetre/inch. We’ll look at applications of this equation a little more this week, e.g. using a spectrometer to measure the angle so we can calculate the wavelength of the light used.

spectrometer

In the meantime, get some practice at using the grating equation with the simulation site shown below.  You can select how many lines you would like per millimeter of grating and alter the wavelength.  Try calculating the angle for the first or second order spots and then use the simulated protractor to see if you are correct.  Click on the image below to get started.

interference simulations

We’ve been looking at interference recently.  I found two nice simulations that you might want to try running at home to confirm your understanding of things like;

  • relationship between fringe spacing in the pattern & wavelength
  • location of the 0, 1st, 2nd order fringes
  • what happens when the screen is moved towards/away from the 2 slits/sources

The first simulation is based on the interference of sound waves and is similar to the experiment we set up last week in class.  Click on the image below to start the simulation, you will need Java for this to work.  Make sure you choose the two source interference tab as shown in the picture.

The second simulation can be run as sound, light or water waves.  I selected the light option for this screenshot.  Click on it to run the simulation.  You are free to run 2 sources or one source with a double slit barrier and adjust the amplitude and wavelength.

The view screen option is nice as it shows what the fringes would look like.  You can also display a plot of light intensity (irradiance).

uranium-235 and nuclear fission

Uranium has several isotopes, all of which are naturally radioactive.  The two most abundant isotopes are

  • U-238 (92 protons, 146 neutrons) 99.28% of uranium is this isotope
  • U-235 (92 protons, 143 neutrons) 0.71% of uranium is this isotope

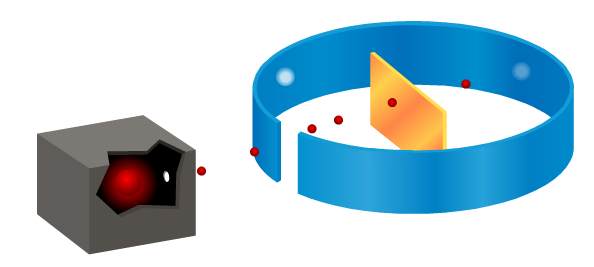
Although less than 1% of all the uranium we can dig out of the ground is the U-235 isoptope, this is the one that gets most attention.  Atoms of U-235 have a special property, they can absorb low energy neutrons and then split up into two smaller atoms.  This process is called fission.  The animation below is a representation of the nucleus of a U-235 atom absorbing a passing (blue) neutron and splitting into two fission fragments as a result.

kernspaltung

Animated gif showing fission of U-235 by Stephan-Xp

The total mass of the original U-235 atom and the single neutron is greater than the combined mass of the two fission fragments and the three new neutrons.  The “missing mass” is converted into energy.  For each U-235 atom that undergoes fission, a large quantity of energy is released.  We can calculate how much energy is released using Einstein’s famous equation

E= mc^2

Notice how the fission process shown above produces 3 new neutrons in addition to the fission fragments.  These neutrons can go on to be absorbed by other U-235 atoms, causing further fission.

If the fission process is controlled, by limiting the number of available neutrons, then it can be used in a nuclear power station.  Without that control, fission occurs rapidly and all of the energy is released in a very short period, resulting in a nuclear explosion.

Only the U-235 isotope is fissile (able to undergo fission) and mined uranium must be processed to remove the U-238 isotope.  This filtering process is called enrichment and Professor Poliakoff from periodicvideos.com has a video that explains the process but thankfully not in enough detail for you to build your own nuclear bomb!

Rutherford’s model of the atom

We’ve been looking at how Ernest Rutherford showed that Thomson’s plum pudding (think of Christmas pudding or fruit cake) model of the atom was incorrect by firing alpha particles at a piece of thin gold foil.  Although most alpha particles passed straight through, some were scattered at large angles, or even came back.

This evidence allowed Rutherford to develop the idea of a nuclear atom, where the mass is concentrated in a small volume at the centre with a positive charge.  The overall charge on the atom remains neutral due to electrons with a negative charge orbiting the nucleus.  Most of Rutherford’s atomic model was empty space!

Here is a screenshot of the animation I used in class, the red spheres represent the alpha particles fired at the gold foil.  You can get the full animation by clicking on the download link at the end of this post.  Watch what happens to them after they reach the gold.

Here’s a youtube video that explains Rutherford scattering and looks at how we can manipulate the nucleus of an atom to turn it from one element into another, a process called transmutation.

Professor Brian Cox goes back to Rutherford’s old laboratory in Manchester in this short video.

In these video clips, you will hear the name of one of Rutherford’s students, Hans Geiger, mentioned.  Hans Geiger went on to invent the radiation detector that is named after him.  In the following clip, taken from a chemistry class at a Canadian university, we see the counter in use by Geiger’s great grandson.

fun with hot gas

Impress your friends at parties with this physics trick.

Now you’ve watched it, go back and listen carefully to the explanation in step 3.  Notice how each step is explained in sequence.  This is the “cause and effect” type of description we discussed last week.

Also notice how the egg is always pushed, it is never “sucked”.  Suck is bad physics!

Higher – improving descriptions and explanations

Mind mapping can be a useful technique for displaying information.  We spent some time last week looking at ways to raise the quality of your written responses to describe & explain questions.

The first task generated themes for a mind map and we went on to use the map to help structure your descriptions in a peer assessment task, where you provided feedback to improve each other’s answers.  Here is the mind map you produced.

Screen shot 2009-11-25 at 10.36.24

I have attached a copy of the group tasks we used as a pdf file.