Goldfinger’s laser – update

Just one comment so far that correctly identifies the bad physics in my post about Goldfinger’s laser.  If anyone else wants to leave a comment I will give you until the end of the Easter holidays to watch the clip and post your ideas.

I won’t publish any of your comments until then.

photoelectric effect

We looked at the photoelectric effect last week.  This video has a similar demonstration to the gold leaf electroscope experiment I showed you in class and includes an explanation of the process.

Click on the picture below to download the simulation we used to investigate the effect of irradiance on frequency on photocurrent.

You can change the metal under investigation (we used zinc in class).  You can also vary the wavelength and irradiance of the light.   Notice that below the theshold frequency you can’t get any photoelectrons, even if you set the light to its brightest setting.

a floating macbook air – discuss

I’ve found something that relates Apple stuff to unit 1 of the Higher Physics course.

Take a look at this video.  It shows an Apple Store display for the new, smaller MacBook Air.

You folks know enough Physics (Newton’s laws, density, pressure, buoyancy, tension) to put together a reasoned argument whether or not that window arrangement should work.

Have a go at describing/explaining/justifying whether or not the MacBook Air should float.  When you’re done, see whether your analysis is anything like Rhett Allain’s blog post about this window display.

Did you think like a Physicist?

measuring internal resistance

Warning: I am expecting you to do more than just read this text.  Please do try plotting the graph and finding the properties of the cell.

We did an experiment in class (it is listed as “Method 2″ in your printed notes) where you built a simple series circuit using a cell, a variable resistor and an ammeter.  A voltmeter was connected across the series resistor and you recorded the voltage across (TPD) & current through the resistor as you changed its resistance.

The video below shows the same type of experiment, but uses a potato and two different metals in place of normal cell.  Watch the video and note the values of I and V each time the resistance is changed – remember you can pause the video or go back if you miss any.

Now plot a graph with current along the x-axis and TPD along the y-axis.  If you don’t have any sheets of graph paper handy, try printing out a sheet from this graph paper website or use Excel or the free OpenOffice.org Calc spreadsheet.  You have probably guessed that I prefer to draw graphs by hand, though.

Draw a best-fit straight line for the points on your graph and find the gradient of the line.  When calculating gradient, remember to convert the current value from microamps (uA) to amps (A).

The gradient of your straight line will be a negative number. The gradient is equal to -r, where r is the internal resistance of the potato cell used in the video.

You can obtain other important information from this graph…

  • Extend your best fit line so that it touches the y-axis.  The value of the TPD where the line touches the y-axis (on the y-axis, I is zero so TPD = EMF) is equal to the EMF of the cell.
  • Now extend the best-fit line so that it touches the x-axis, the current at that point is the short-circuit current – this is the maximum current that the potato cell can provide when the variable resistor is removed from the circuit altogether and replaced with just a wire.

the wheatstone bridge

We’ve just completed the section of Higher unit 2 that investigates the behaviour of a Wheatstone Bridge. The bridge circuit is really just a pair of voltage dividers connected in parallel.  A voltmeter, ammeter or galvanometer (very sensitive ammeter) connects the two voltage divider chains together, as shown below.

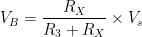
When the voltage (or current) displayed on the meter is zero, we say that the Wheatstone bridge is balanced.  For a balanced bridge, it is possible to show that

\displaystyle {R_1 \over R_2} = \displaystyle {R_3 \over R_4}

[you have this proof in your notes folder]

For the circuit shown above, the voltmeter will display the difference in electrical potential between points B and D. We can calculate this potential difference by finding the voltages at points B and D using the voltage divider equation you used for National5/Standard Grade/Intermediate 2 Physics.

V_2  = \displaystyle { R_2 \over {R_1+R_2}} \times V_s

So in this example,

V_D = \displaystyle {R_2 \over {R_1+R_2}} \times V_s

and

V_B  = \displaystyle {R_X \over {R_3+R_X}} \times V_s

The voltmeter displays the potential difference between these two points, i.e.

V_G  = V_D-V_B

Here is a short video that provides a recap of the Wheatstone Bridge.

and a worked example from an old SQA past paper

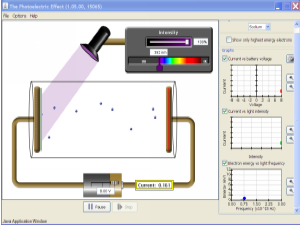
Now click on the picture below to try an interactive Wheatstone Bridge problem (you will need to have Java installed).

Instructions:

  • Press the Reset button to change the value of all the resistors in the circuit.
  • Use the slider to balance the bridge. The circuit uses a centre-zero meter, so aim to get the indicator dead centre.
  • Find the unknown resistance (R4) using the value of the other 3 resistors when the circuit is balanced.

You can repeat this simulation as many times as you like by pressing Reset to change the resistor values…..it’s great practice!

Here is an example of an application of the Wheatstone Bridge, called the metre bridge.

When a Wheatstone Bridge is slightly out of balance, it will provide a linear response.  In other words, small changes in resistance will produce proportionally small changes in voltage or current.  When these small changes are plotted, we obtain a straight line through the origin, like this:

We tried to use this property of a Wheatstone Bridge to find the temperature of the physics classroom.  We used some of the snow outside for a low temperature and boiling water for a high temperature.

As we discussed today, this was not a particularly successful experiment due to the non-linear response of the thermistor to changes in temperature – you might remember this from Standard Grade or Int 2 Physics.

For temperature ranges much smaller than the 100°C we attempted, it is possible to obtain an accurate estimate of room temperature.

Click on the download link below to try some Wheatstone Bridge questions.