
That’s the 2023 papers uploaded now, sorry for the delay.
charged particles in magnetic fields
These Bitesize pages will help if you need to recap on the basics of magnets. A magnetic field is produced whenever current flows through a wire. The magnetic field is represented by a series of concentric circles around the wire, as shown below.

Magnetic field lines around a current carrying wire. image: physick wiki
The direction of the arrows on these magnetic field lines is found using a left hand rule:
Point your thumb in the direction of electron flow, then wrap your fingers around the wire. The direction in which your fingers curl is the same as the arrow direction.
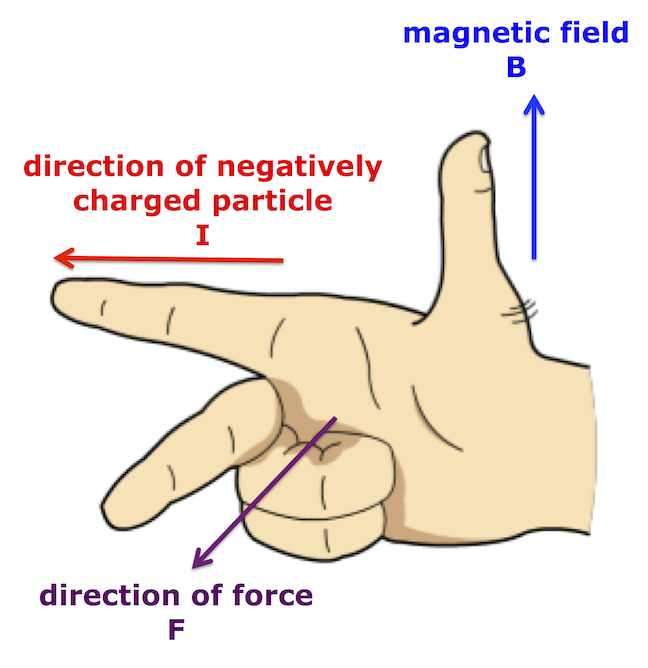
A charged particle will experience a force as it moves through a magnetic field – apart from the special case where the particle enters parallel to the magnetic field lines. There are different ways to determine the direction of the force acting on the charged particle. The following method works for negatively charged particles.
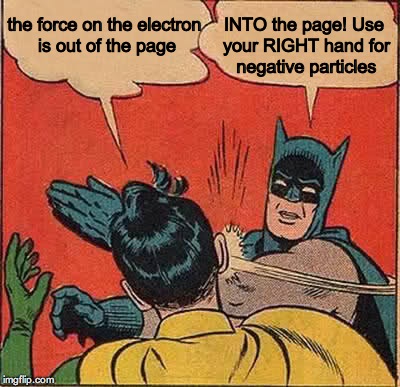
Hold out your right hand and make a fist like Batman.…BIF!

Batman making a fist with his right hand. image: infinitehollywood.com
Still thinking about BIF…
- Straighten your thumb (B), first finger (I), and middle finger (F) so they are at 90 degrees to one another, like the x,y,z axes on a graph.
- Align your thumb so it points in the same direction as the arrows† on the magnetic field lines (B).
- Rotate your right hand until the first finger direction matches the path of the negative particle (I).
- Your middle finger will reveal the direction in which magnetic force (F) acts on the negative particle.
† if no field lines are shown, position your thumb so it points from N to S in the magnetic field
If you’ve done everything correctly, the fingers of your right hand will look like this.
Right hand rule for negatively charged particles in a magnetic field.
If you are working with positive particles, there are two options:
- use your left hand instead of the right, keeping the same BIF order for the fingers OR
- use the right hand rule described above but reverse the direction of the force at the end.
Try both methods and decide which is best for you.
If you opt to use different hands, make sure you know which hand to use for each type of charge.
Why do we use B as the symbol for magnetic fields? I have no idea, but there are some suggestions here.
electric field line patterns for point charges and parallel plates
These short video clips show how to draw electric field lines for point charges and parallel plates.
Q1(a) Electric fields lines around point charges from mr mackenzie on Vimeo.
Q1b – Electric field between parallel plates from mr mackenzie on Vimeo.
particles in electric fields
An electric field can be used to accelerate charged particles. Conservation of energy tells us that the work done by the field is equal to the change in the particle’s kinetic energy. The speed of the particle can be determined if its charge and the accelerating voltage are known. These notes show how to perform the calculation.
These short video clips show how to draw electric field lines for point charges and parallel plates, with example calculations for the work done by electric fields and the final speed of charged particles in electric fields.
Q1(a) Electric fields lines around point charges from mr mackenzie on Vimeo.
Q1b – Electric field between parallel plates from mr mackenzie on Vimeo.
Q2 – Work done in moving a charged particle through a potential difference from mr mackenzie on Vimeo.
Q3 – Calculating the speed of a charged particle in an electric field from mr mackenzie on Vimeo.

forces
We’ve been looking at forces for the past two weeks. Here are some notes and videos to help you learn more about this topic.
Newton’s 1st Law
animation showing effects of air resistance
Friction: here are 3 clips about friction from the BBC programme Bang goes the Theory
fundamental particles: quarks, leptons and the standard model
At the end of Our Dynamic Universe, we considered big things like stars, galaxies and the Universe itself. Now the Particles and Waves unit brings us to particles so small we need groups of them just to make a single atom. Is there a connection?
Why do we study particles? from mr mackenzie on Vimeo.
The Standard Model
An elementary (or fundamental) particle is a particle that is not built from other, smaller particles. Until the start of the 20th century, scientists had believed that atoms were elementary particles. However, the discovery of the electron (J.J. Thompson), proton (Rutherford), and neutron (Chadwick), together with Rutherford’s evidence for a heavy, positively charged nucleus at the centre of the atom suggested the atom was not an elementary particle after all.
Brian Cox explains in this video clip…
dark matter, dark energy and the end of the Universe
It’s complicated and cosmologists are not certain. One of the issues is only being able to see about 4% of the mass in the universe – the stars, planets, gas and dust. About 25% of the mass of the universe is Dark Matter. It’s “dark” because it doesn’t emit light that enables us to see it. Vera Rubin and Fritz Zwicky were the two astronomers who produced observations that led to the dark matter theory.
Vera Rubin measured star velocities in the Andromeda galaxy and plotted these against the star’s distance from the centre of the galaxy. Knowledge of rotational speeds within our Solar System would predict a graph similar to curve A. What she obtained was a relatively flat graph (B).
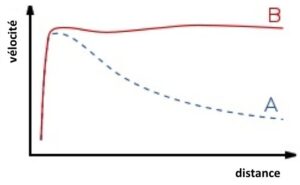 image from Quantum Diaries
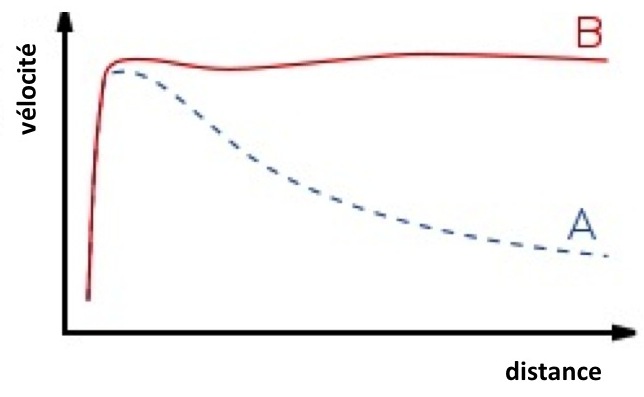
The rotational speed of the stars in curve B are far too fast for the Andromeda galaxy to stay together. The only explanation for the galaxy staying together was the presence of an awful lot of additional mass that couldn’t be detected. This new mass was named dark matter.
Rubin talks about her discovery in this video.
Vera Ruben dark matter dark energy from mr mackenzie on Vimeo.
Zwicky had been looking at clusters of galaxies, rather than individual stars within galaxies. He found something similar; the galaxies were swirling round at too great a speed and should fly apart.
evidence supporting the Big Bang model: 3. Olber’s paradox
You might remember that we looked at some paradoxes when we studied special relativity earlier this term. Here is another situation where a paradox can arise. The German astronomer Heinrich Olbers (1758–1840) asked why the night sky was dark. At the time, astronomers believed that the Universe was both infinite and steady state (unchanging), so it seemed like a good question.
- Wouldn’t there be a star in any direction you chose to look?
- Shouldn’t the light from that star prevent the night sky from looking dark?
Well, the problem is that the Universe is not infinite because it is still expanding. The Universe also isn’t steady state because it is… expanding. It turns out that a question posed by a follower of the infinite, steady state model of the Universe is actually a decent piece of evidence in support of the Big Bang model of the Universe.
Watch these two videos and see how they chip away at the paradox and show how the answers to the question turn out to support the expanding Universe model.
evidence supporting the Big Bang model: 2. nucleosynthesis
As we worked through the diagram explaining the stages of the Big Bang model, we looked at a section of the diagram where the Universe was hot enough for nuclear fusion. At this point, hydrogen nuclei were fusing together with other hydrogen nuclei to create helium nuclei. As the Universe expanded, it cooled and further fusion was not possible. As a result, we have a Universe with the same proportion of hydrogen to helium wherever we look: we find 75% hydrogen and 25 % helium. This can only be the case if all of the helium was produced at the same place and the same time, i.e. in a very small, very hot Universe.
Hydrogen, helium and cosmic microwave background radiation from mr mackenzie on Vimeo.
evidence supporting the Big Bang model: 1. CMBR
introduction to the Big Bang from mr mackenzie on Vimeo.
Georges Lemaître’s theory of an expanding Universe, which has become known as the Big Bang, was supported by Hubble’s observations. The expanding Universe idea was challenged by influential scientists who believed the Universe was both infinite (and therefore not expanding) and steady state (unchanging). Supporters of the Big Bang idea needed to find other evidence that could confirm their model was correct.
The cosmic microwave background radiation (CMBR) is radiation left over from the big bang. When the universe was very young, only 380,000 years old, just as space became transparent to light, electromagnetic energy would have propagated through space for the very first time. At this stage in its development, the temperature of the Universe would have been about 3000K. Nowadays, the temperature of space has fallen to approximately 2.7 K (that’s 2.7 K above absolute zero!) and, using Wien’s Law, we can confirm that the peak wavelength of the electromagnetic radiation is so long that the background radiation lies in the microwave portion of the em spectrum.
The CMBR was first detected in 1964 by Richard Woodrow Wilson and Arno Allan Penzias, who worked at Bell Laboratories in the USA.