Our Sun is a typical yellow star, so its emission would be represented by the middle star in this image.

image courtesy of kstars, kde.org – colour is exaggerated
The colour of a star also tells us something about the expected behaviour of a star, it’s lifetime, and destiny. This is achieved by plotting stars on a Hertzsprung-Russell diagram. More about HR diagrams here.
This video clip looks at how the stars are arranged on the HR diagram.
Hertzsprung Russell diagram from mr mackenzie on Vimeo.
While some HR diagrams use temperature along the x-axis, others use star classification. You can learn more about star classification in this Sixty Symbols video.
Now test your understanding of the HR diagram.
Red giants appear as one group on the HR diagram. These stars are much larger than our Sun, click on the image below and zoom in to compare sizes.
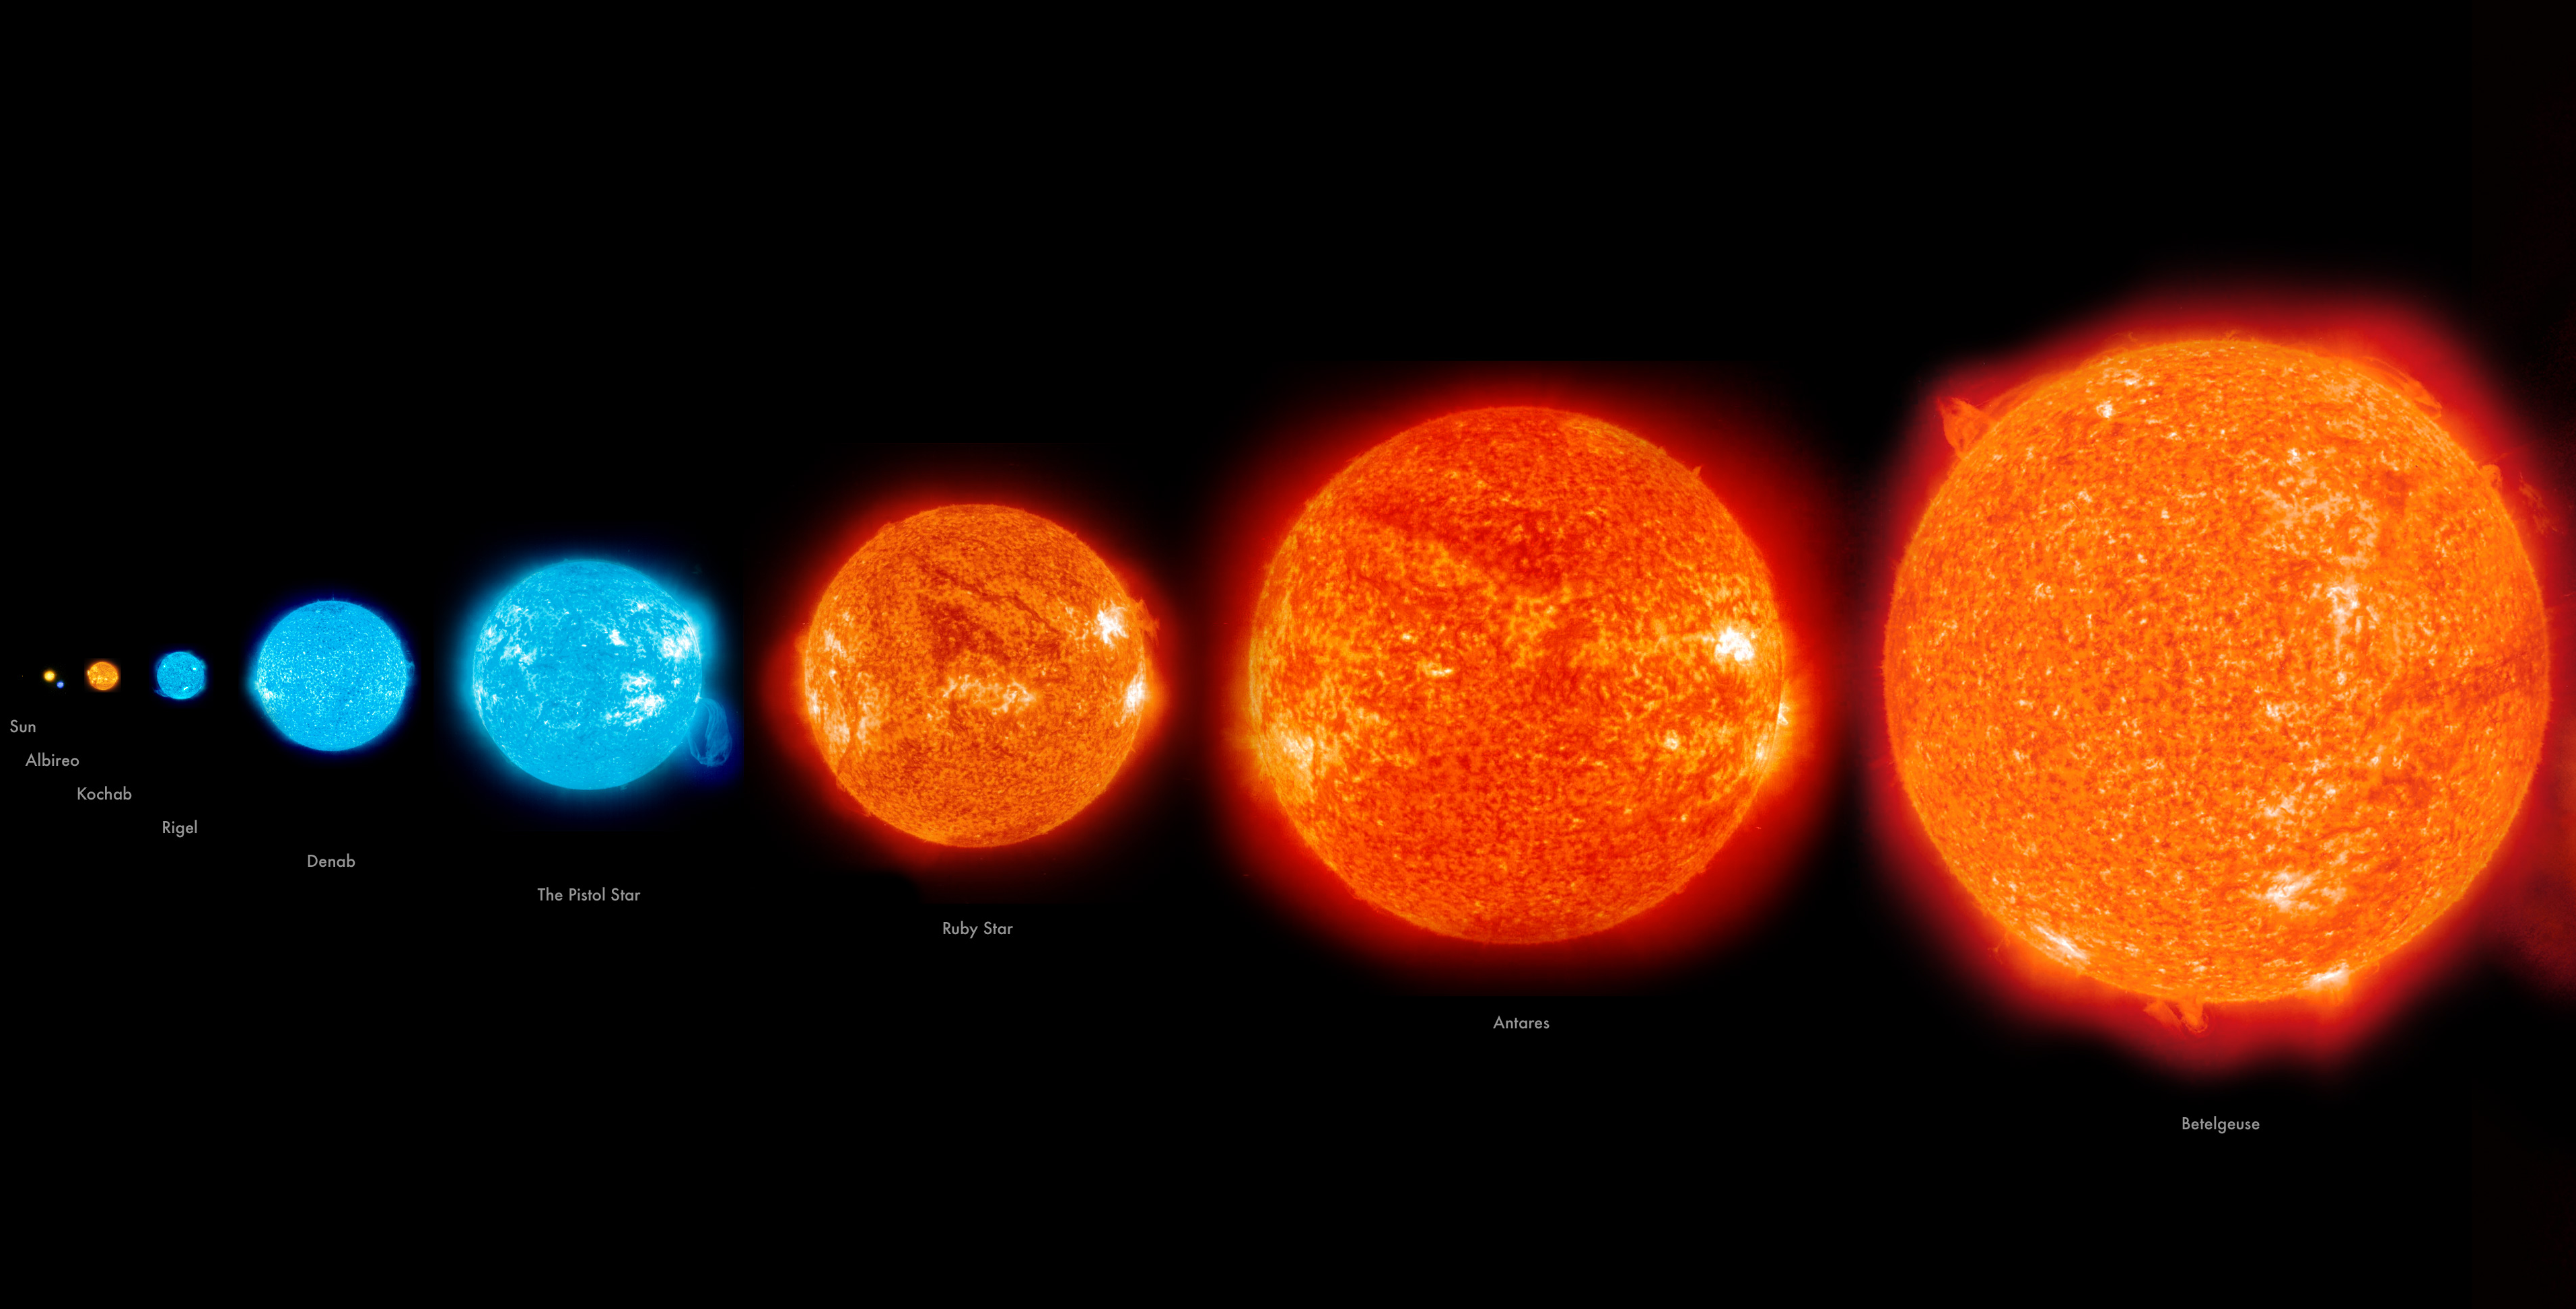 scale of our Sun and several red giant stars: image from Osservatorio Astronomico Di Cagliari
Here is a video clip to explain internal processes in red giants.
red giants from mr mackenzie on Vimeo.
White dwarf stars appear as a cluster in the bottom left of the Hertzsprung-Russell diagram. This video discusses the mechanism that prevents a white dwarf star from collapsing.
white dwarfs from mr mackenzie on Vimeo.